class: # Share & Wrap-up ### Session 4 <div class="title-footer"> <img src="images/academy-logo.png"> <div> August 12th, 2024</div> </div> --- # Agenda 1. Finish your data exploration (30 min) 2. Share your progress with your group (30 min) 3. Wrap-up (recap and resources) (30 min) --- # Finish your data exploration * **Import your data** into R (anyone working with files formats other than .csv?) * **Compute summary statistics** to better understand your data -- what types of variables do you have? How much variation is there within certain variables of interest? * **Follow your curiosity** -- what relationships do you want to explore? Come up with one or two questions to investigate. * **Create at least one plot and one table** to explore patterns of covariation in the data * (Optional) **Create a rendered Quarto report**. Add formatting to your document and experiment with different output formats ## 🕰 Until 4:00 PM --- # Share your work * What did you learn? Where did you struggle? * Pick one plot or table and walk through how you created it ## 🕠 Until 4:30 PM --- # Wrap-up 1. Resources + Best practices 2. Continuing education 3. Conference schedule 4. Feedback survey --- class: middle chapter-slide red .big-white-number[1.] # Resources + Best practices --- # Project-oriented workflows .pull-left[ Use R projects to make your code more organized and shareable *** Resources: * [What They Forgot to Teach You About R Chapter 3: Project-oriented workflow](https://rstats.wtf/projects) * [R4DS Chapter 6: Script and Projects](https://r4ds.hadley.nz/workflow-scripts) * The [here package](https://here.r-lib.org/) (to manage file paths) ] .pull-right[ 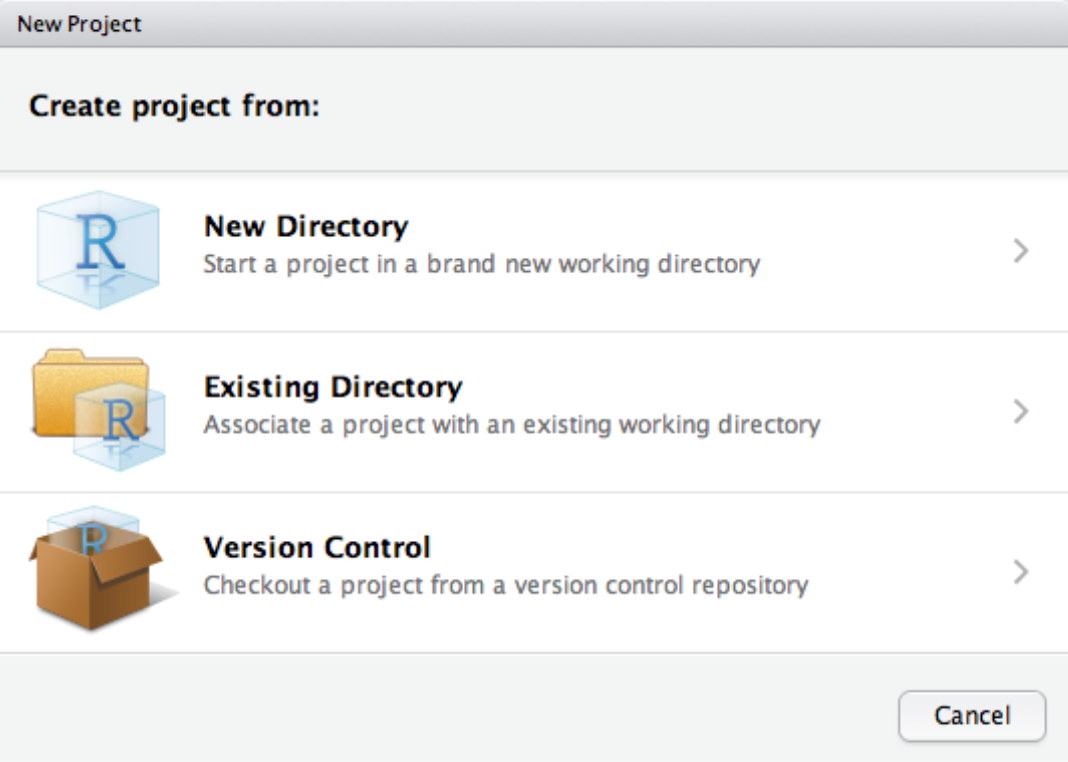<!-- --> ] --- # Code style .pull-left[ Consistent style makes your easier to read & debug by your future self and collaborators *** Resources: * [Tidyverse style guide](https://style.tidyverse.org/) * The [styler package](https://styler.r-lib.org/) * [R4DS Chapter 4: Code Style](https://r4ds.hadley.nz/workflow-style) (short primer) ] .pull-right[ 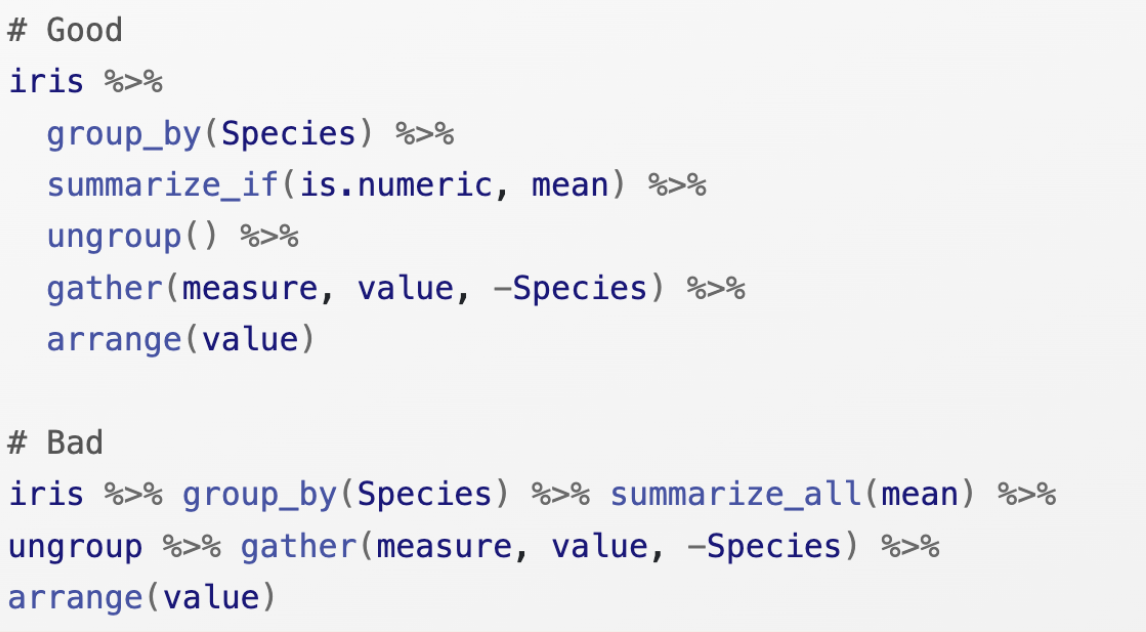 ] --- # Quarto <iframe src="https://quarto.org/docs/gallery/" width="100%" height="400px" data-external="1"></iframe> [quarto.org/docs/gallery](https://quarto.org/docs/gallery/) --- # Quarto (at conf) 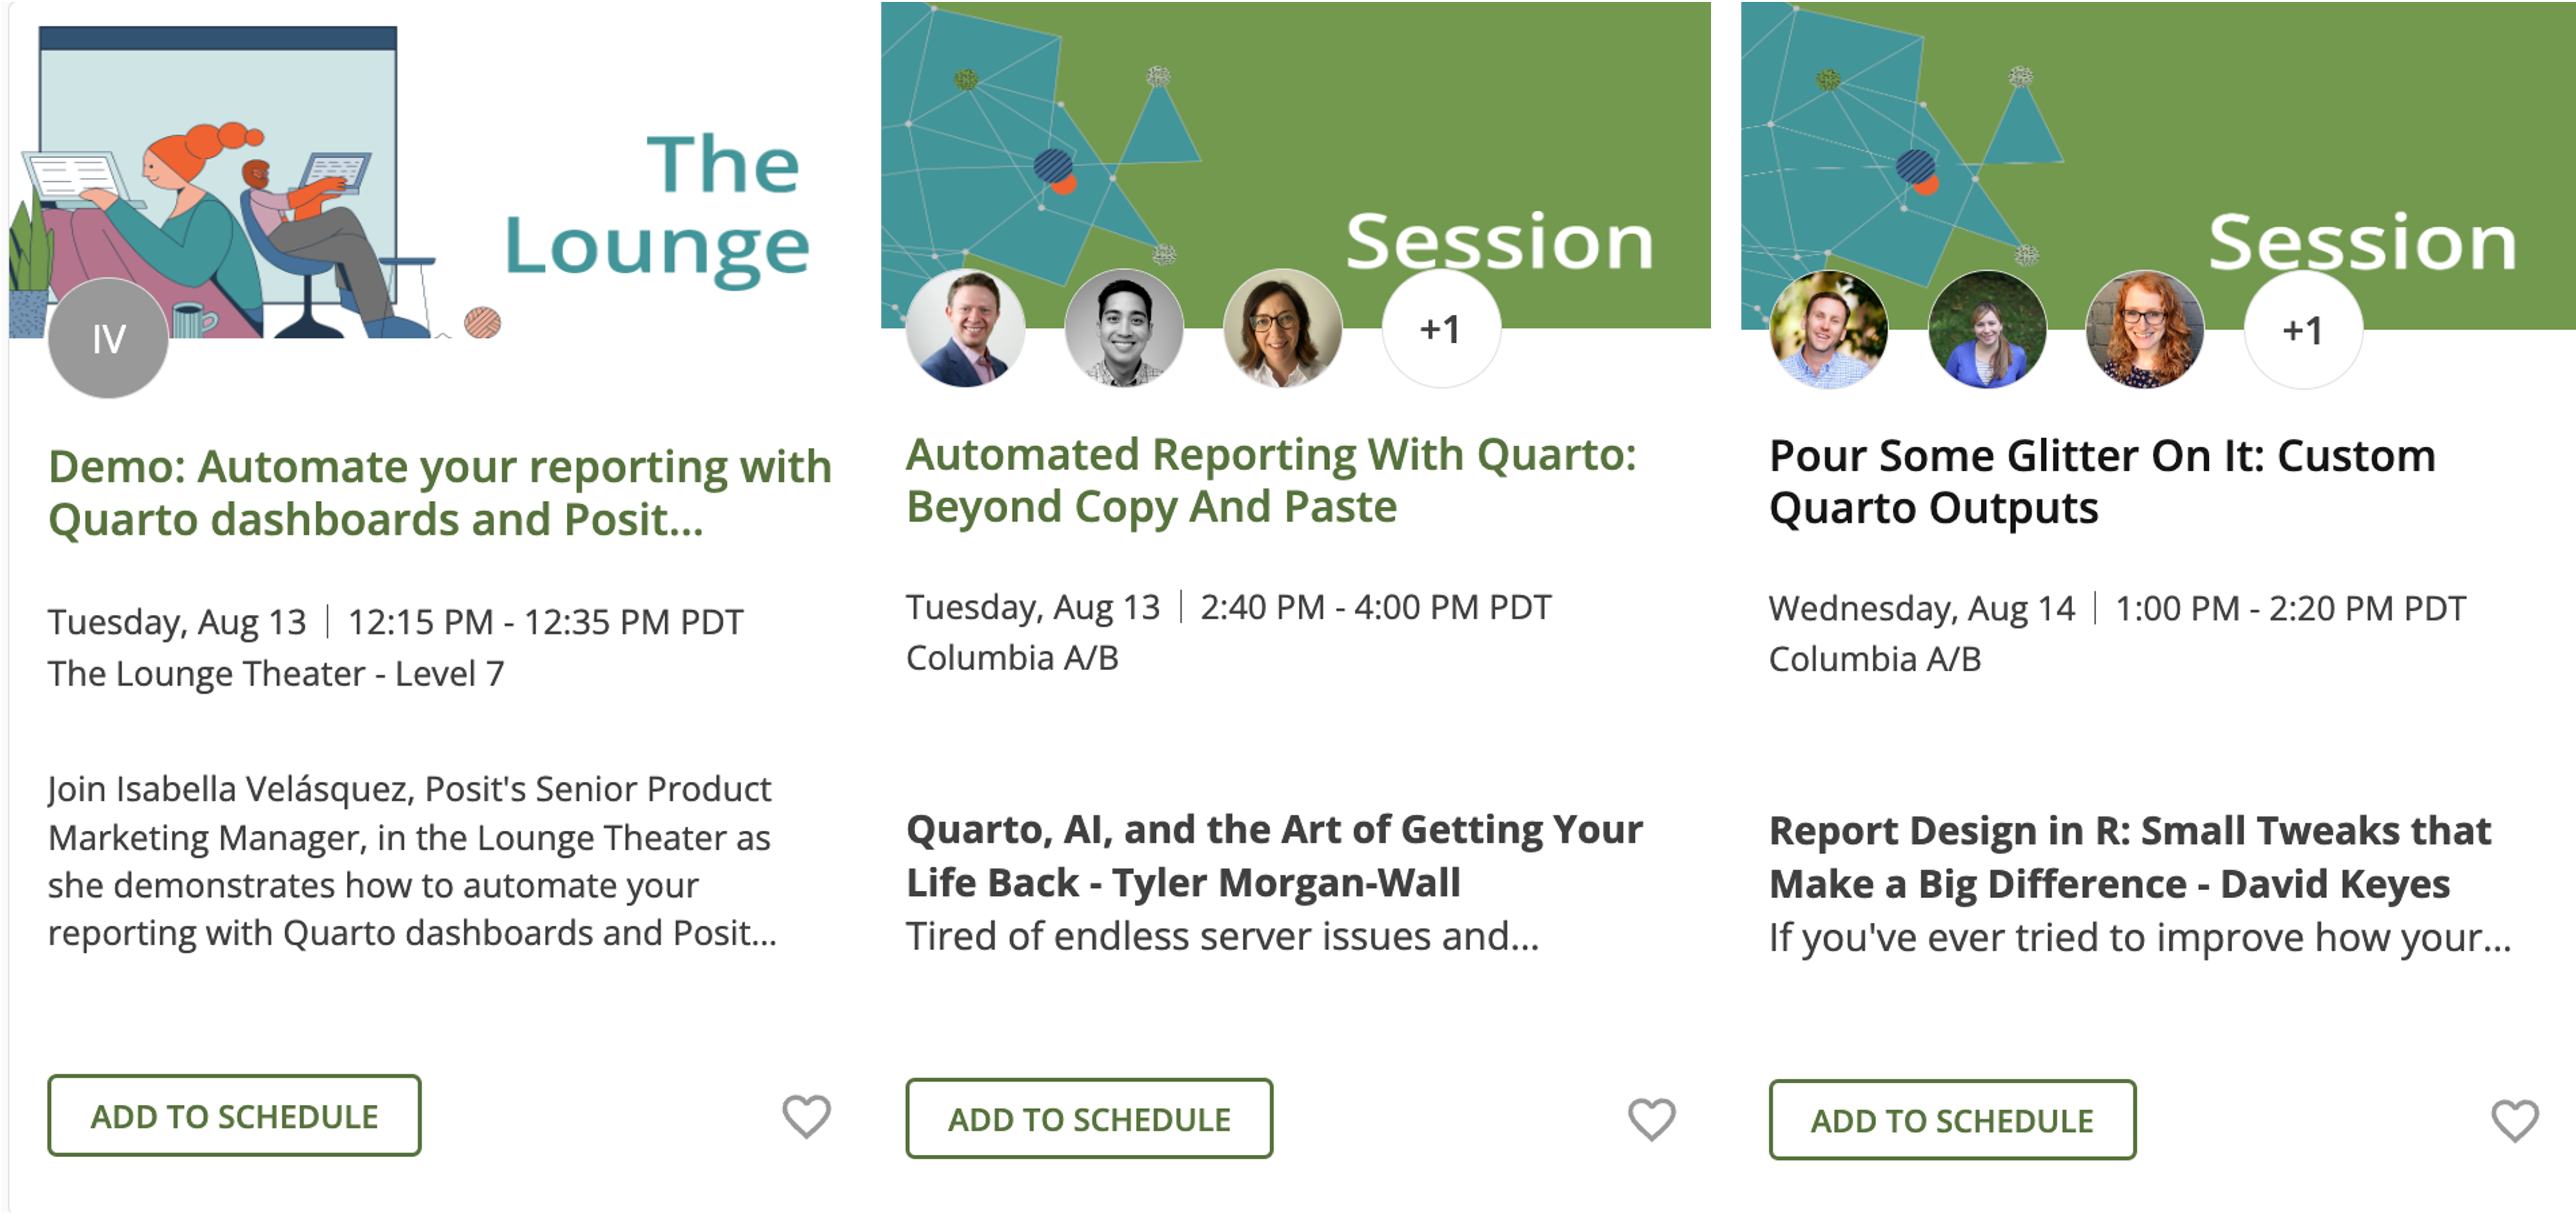<!-- --> --- # Positron 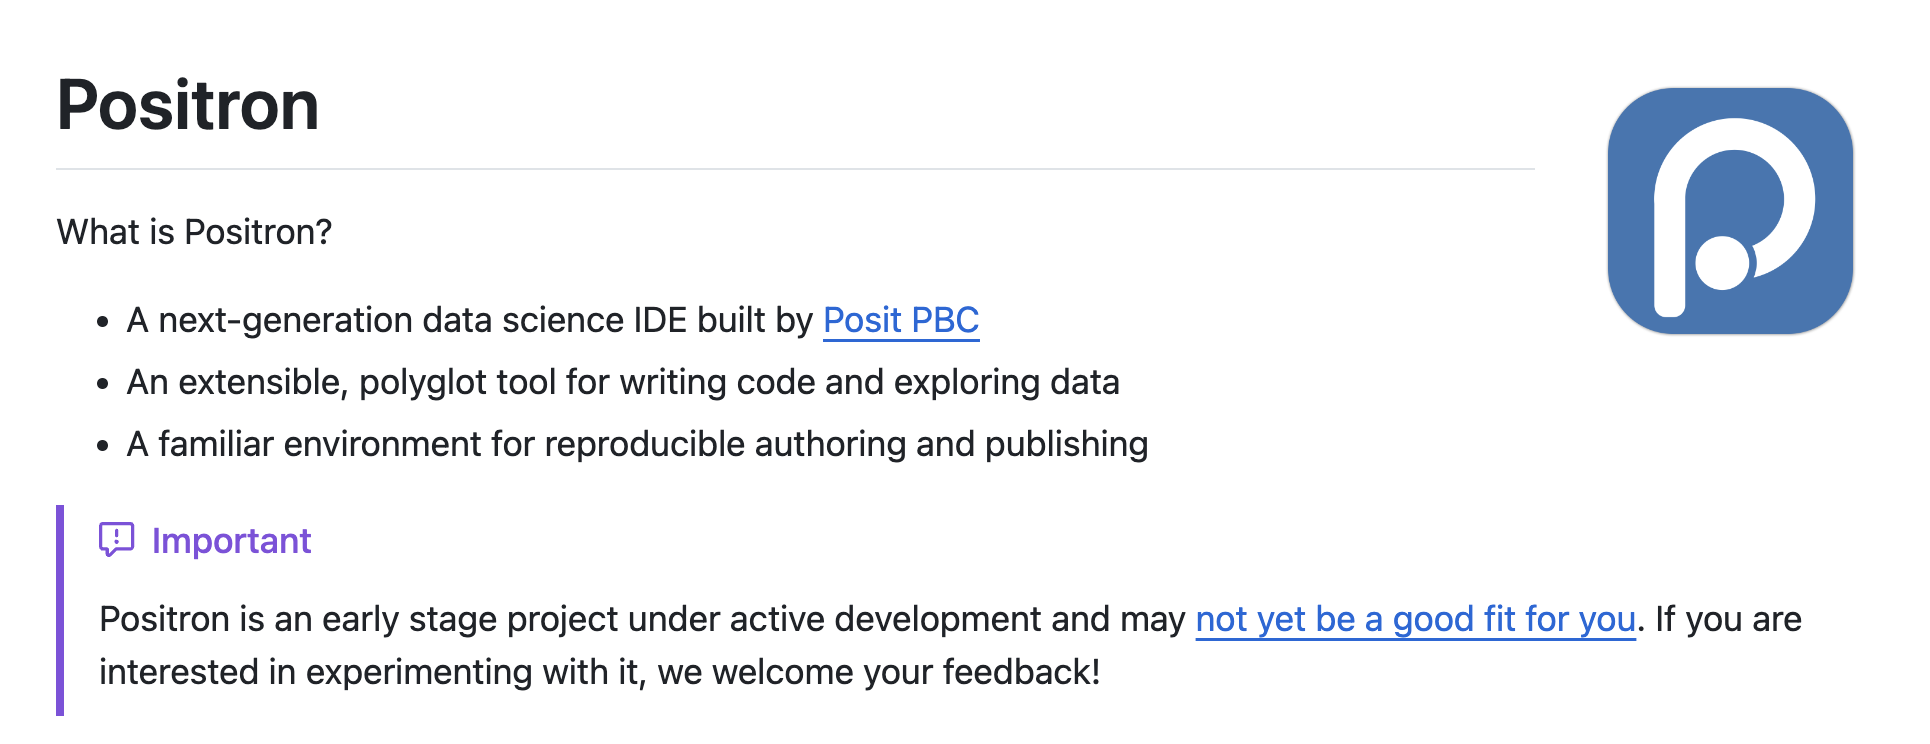<!-- --> [github.com/posit-dev/positron](https://github.com/posit-dev/positron) --- # Positron (at conf) <img src="images/wrap-up/positron-sessions.png" width="70%" /> --- class: middle chapter-slide blue .big-white-number[2.] # Continuing education --- # [rconf.posit.academy](https://rconf.posit.academy/) * You will have continued access to the Academy website for 45 days (Slack channels will stay up until August 30th). Check out optional tutorials and case studies for more practice. * You can download milestone materials for later reference. In your Files pane: 1. Click **Home** and select the folder(s) you want to export 1. Click **More** 1. Click **Export...** (and save a .zip file to your computer) <img src="images/wrap-up/export-from-campsite.png" width="50%" style="display: block; margin: auto;" /> --- # Books and websites * [R for Data Science](https://r4ds.hadley.nz/) (second edition) * [ggplot2: Elegant Graphics for Data Analysis](https://ggplot2-book.org/index.html) (third edition) * …and many many more! (See [Big Book of R](https://www.bigbookofr.com/)) * [Posit Community](https://community.rstudio.com/) – an online forum where you can search, read, or post questions about R * The [tidyverse blog](https://www.tidyverse.org/blog/) – for all the latest updates and features * [TidyTuesday](https://github.com/rfordatascience/tidytuesday#readme) – weekly opportunity to practice using new datasets to create data visualizations using R --- <div class="title-footer"> <img src="images/academy-logo.png"> <div> More info at <a https://posit.co/products/enterprise/academy/" rel="noopener noreferrer" target="_blank">posit.co/academy</a></div> </div> # Posit Academy **Foundations of the Tidyverse** (10 weeks) - Import, visualize and wrangle data with the tidyverse and report reproducibly with Quarto **Foundations of Python for Data Science** (10 weeks) - Import, visualize data with plotnine, wrangle data with pandas and report reproducibly with Quarto **Programming in R** (6 weeks) - Write functions in R, iterate and debug code **Shiny for R** (4 weeks) - Build Shiny apps to automate work and make data more user-friendly ### 👋 Email us academy@posit.co - or ask any Posit employee in the Lounge! --- class: middle chapter-slide green .big-white-number[3.] # Conference schedule --- # Search for sessions by topic .pull-left[ Browse the [session catalog](https://reg.conf.posit.co/flow/posit/positconf24/publiccatalog/page/publiccatalog) 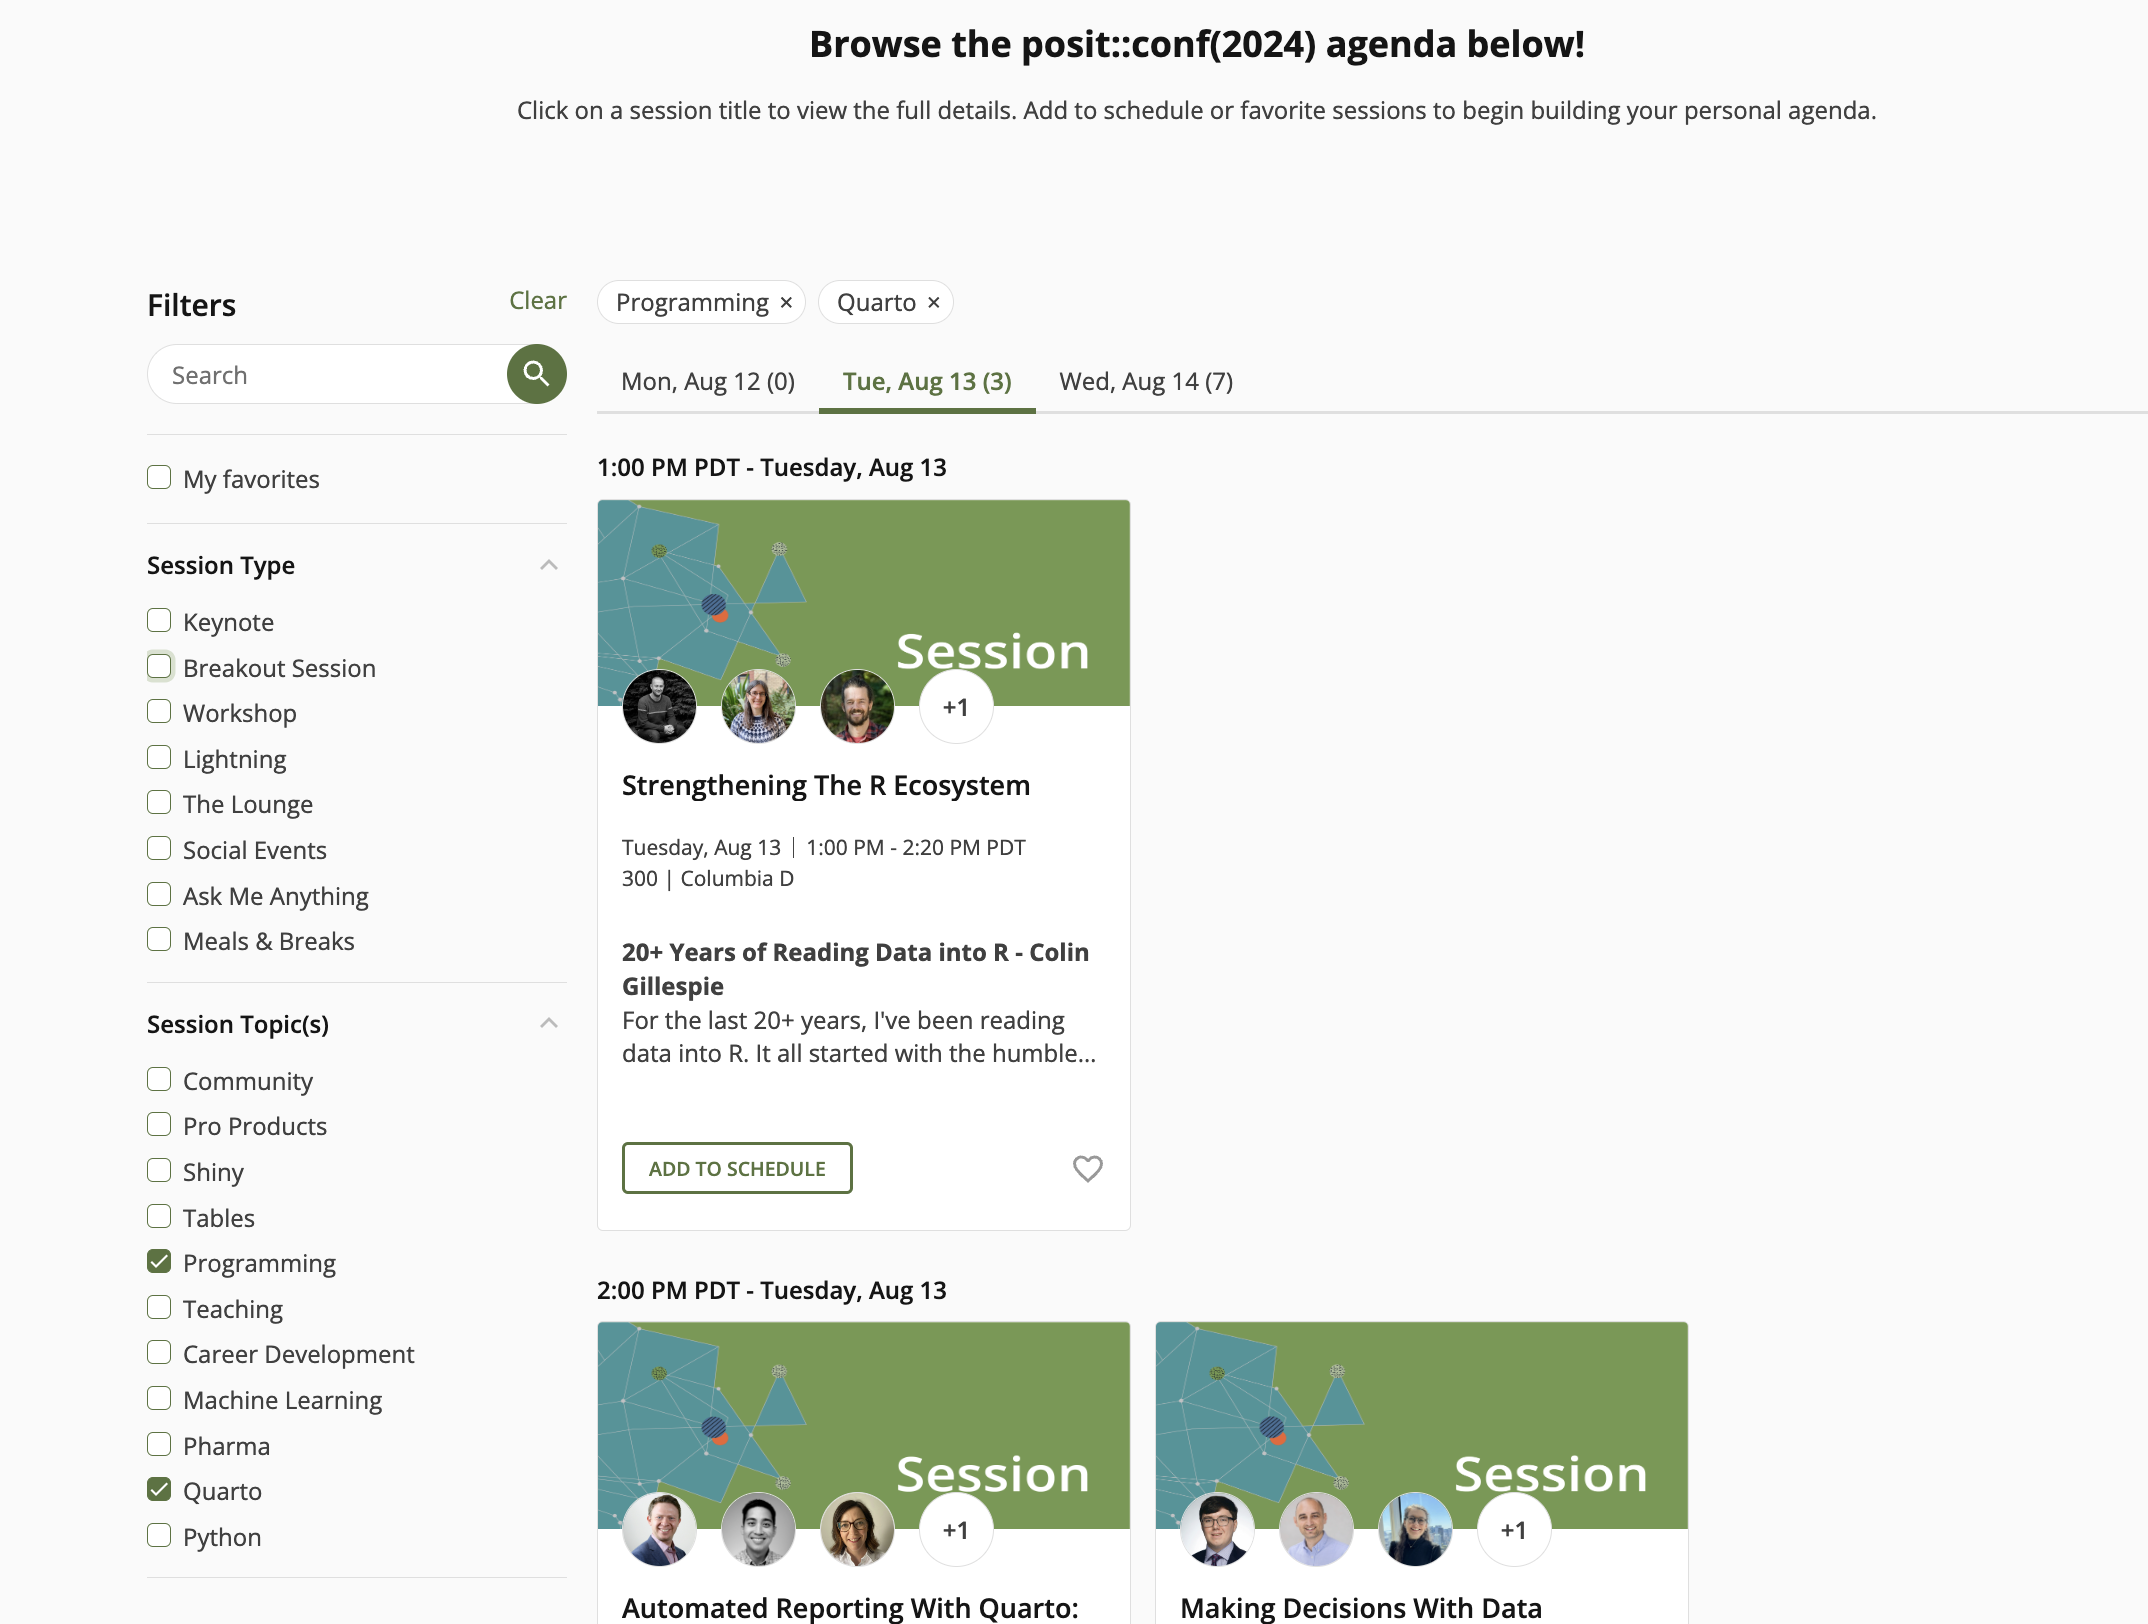<!-- --> ] .pull-right[ Download the mobile app <img src="images/wrap-up/mobile-app.png" width="70%" /> ] --- # Social/Networking events 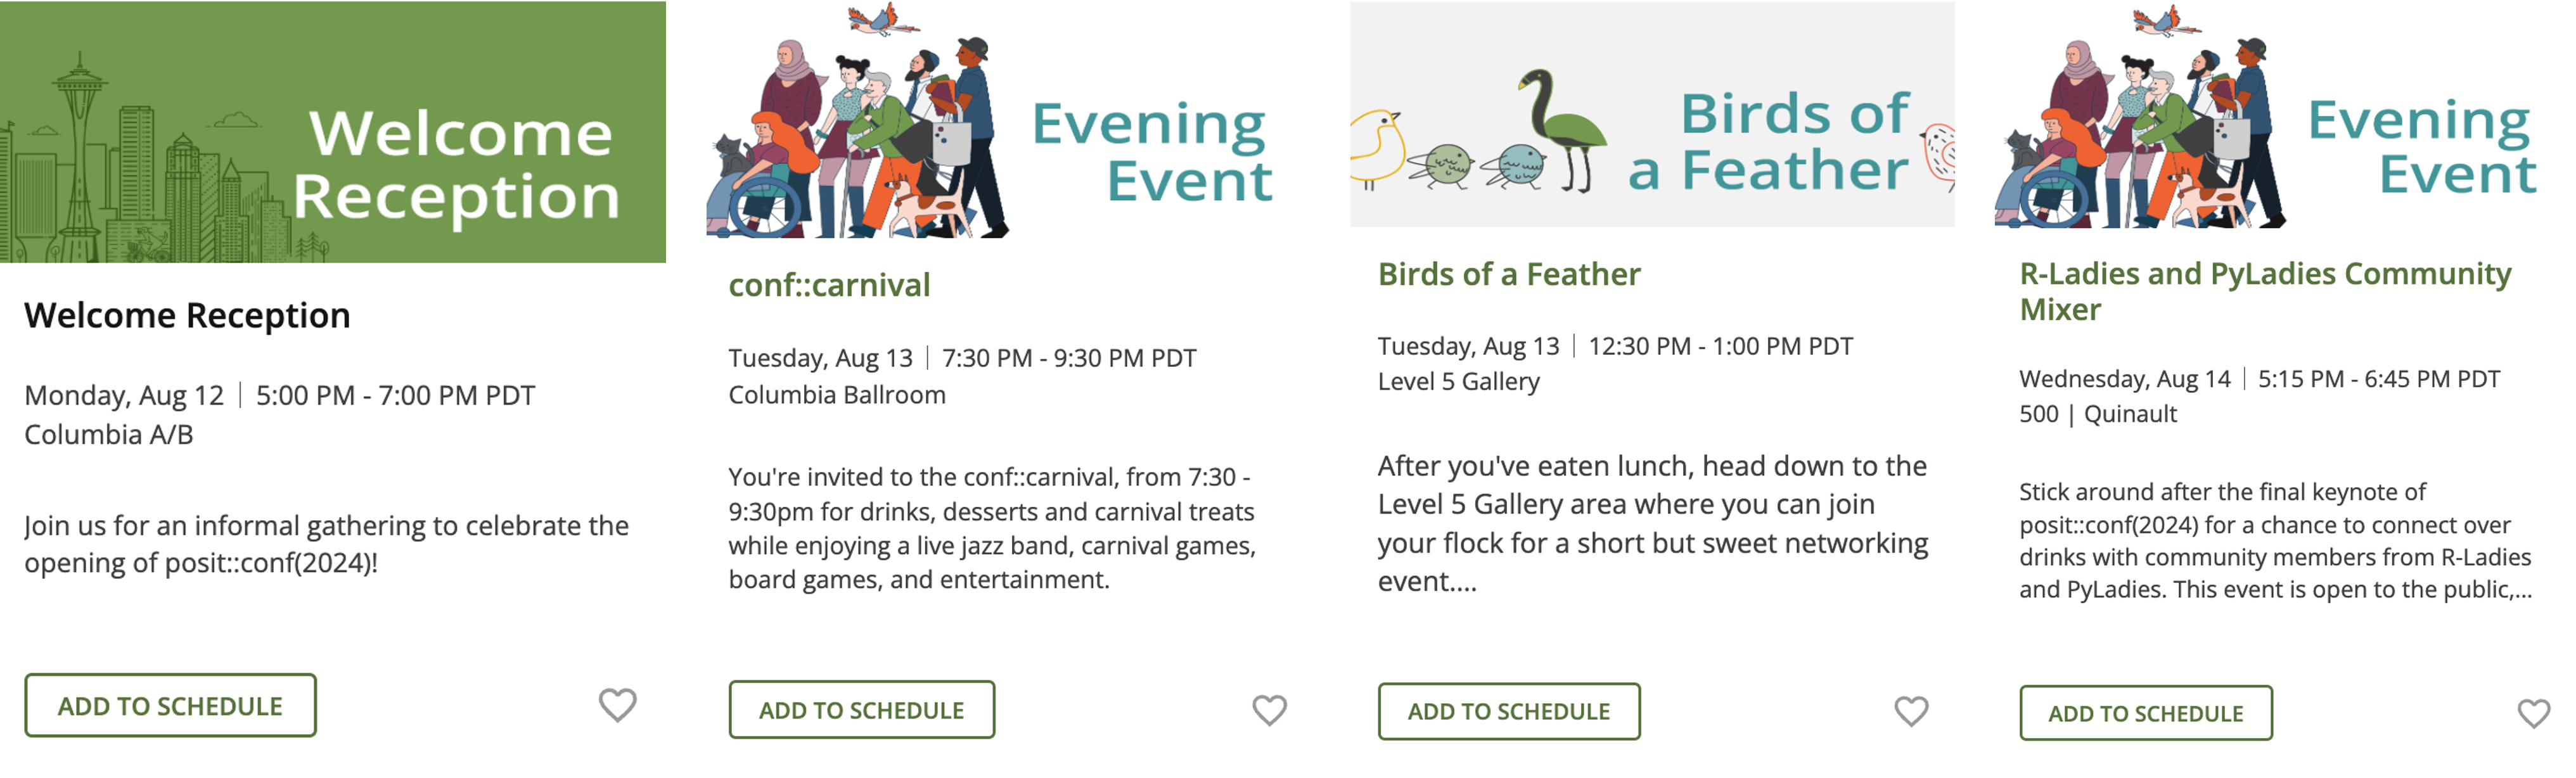<!-- --> --- class: middle chapter-slide tan .big-white-number[4.] # Feedback --- class: your-turn # Your turn ## Please go to [pos.it/conf-workshop-survey](http://pos.it/conf-workshop-survey) Your feedback is crucial and informs curriculum and format decisions for future workshops. We really appreciate you taking the time to provide it :-) --- class: center, middle # [pos.it/conf-workshop-survey](http://pos.it/conf-workshop-survey) ### Thank you so much for being a part of this course + workshop! <!-- -->